User Guide
Welcome to the jamovi user-guide. This contains everything you need to know about getting up and running for jamovi. Note that there are also video tutorials available from ![]() , and the learning statistics with jamovi textbook for those who prefer those formats.
, and the learning statistics with jamovi textbook for those who prefer those formats.
Installation
Windows
jamovi is available for Windows Vista (64-bit) and above. Installation on windows is quite straight-forward, and should be familiar to anyone who has installed software on Windows before. Download the latest version from the download page, and double-click the icon.
A note about international characters; under windows, the 2.4 series of jamovi and earlier made use of R 4.1 and earlier. These earlier versions of R did not support unicode natively, and some users experienced problems with data sets containing international characters. The 2.5 series of jamovi (and newer) began using R 4.3 (and newer) which addresses this shortcoming (more details here), however this international character support requires the 2019 version of windows 10 or newer.
At some institutions (particularly universities), the “normal” approach to installing software is blocked by IT security policies. In this case, you can download our .zip version. To use this, simply download, unzip to a location on the computer, and naviagate to the bin folder. Double-clicking jamovi.exe will begin jamovi. It’s possible that additional security restrictions prevent jamovi from working in this way, in which case it would be worth raising the issue with your IT staff.
macOS
jamovi is available for macOS 10.13 (High Sierra) and newer. Note that .omv files written using a newer series are often not able to be opened by an older series. The minimum versions reflect the requirements of the corresponding R version which ships with each version.
To install jamovi on macOS, download the .dmg file (downloads here), and double-click the downloaded file. This will present you with a “file view”, and you can install jamovi by “dragging-and-dropping” the jamovi application to the Applications folder (in the usual way). After this, jamovi will appear in your applications, and can be started like any other installed application.
macOS file associations
Some users experience an issue where macOS doesn’t “associate” the different data files (.csv, .omv, etc.) with the jamovi application. This means that double clicking these files won’t open them in jamovi. A simple work around is to open the file using the “hamburger menu” at the top left of the jamovi window. Alternatively, files can be associated with jamovi by first locating a .omv file in the macOS find, ctrl-click on the file, select ‘Get Info’ from the menu. In the info box, navigate to ‘Open with’, then ‘Other …’, and then select the jamovi application. Following this, select ‘Change All …’, and that will associate jamovi will all .omv files (i.e. double clicking .omv files will open in jamovi).
iPad
jamovi is available for iPads with the cloud version; see below.
Linux and Chromebooks
jamovi is currently available for Linux, (for all ‘flatpak participating linux distributions’ – which is most of them), and Chromebooks, from flathub.
Note: Some Chromebooks experience a blank screen issue when starting up jamovi. If you encounter this, there are instructions on how to fix this a little further down. If the problem persists, you may have to use the cloud version.
If you’re new to flatpak/flathub, you’ll need to follow the setup guide on our flathub page.
If you’re an old hand at flatpak, you can install jamovi with the command:
flatpak install flathub org.jamovi.jamovi
and later, you can update your version of jamovi with:
flatpak update
Text not appearing in plots under linux
On some linux machines, the flatpak font cache is not up-to-date, resulting in plots in jamovi not displaying text correctly. To remedy this, you can run the following command at the terminal:
flatpak run --command=fc-cache org.jamovi.jamovi -f -v
This appears to be an issue with flatpaks, and we’re working with the flatpak community to get to the bottom of it.
Blank screen at startup on Chromebooks
Some Chromebooks experience a blank screen when starting up jamovi. The cause of this issue is not completely clear at this time, however it can be fixed by disabling “Crostini GPU support”.
Enter chrome://flags/ into the ChromeOS address bar. This will bring up “Experiments”. Search for Crostini GPU Support and set it to disabled. After restarting your Chromebook the issue should be fixed. If the problem persists, you may have to use the cloud version.
Cloud
See here for more information.
Getting Started
When first starting jamovi, you will be presented with a user interface which looks something like this.
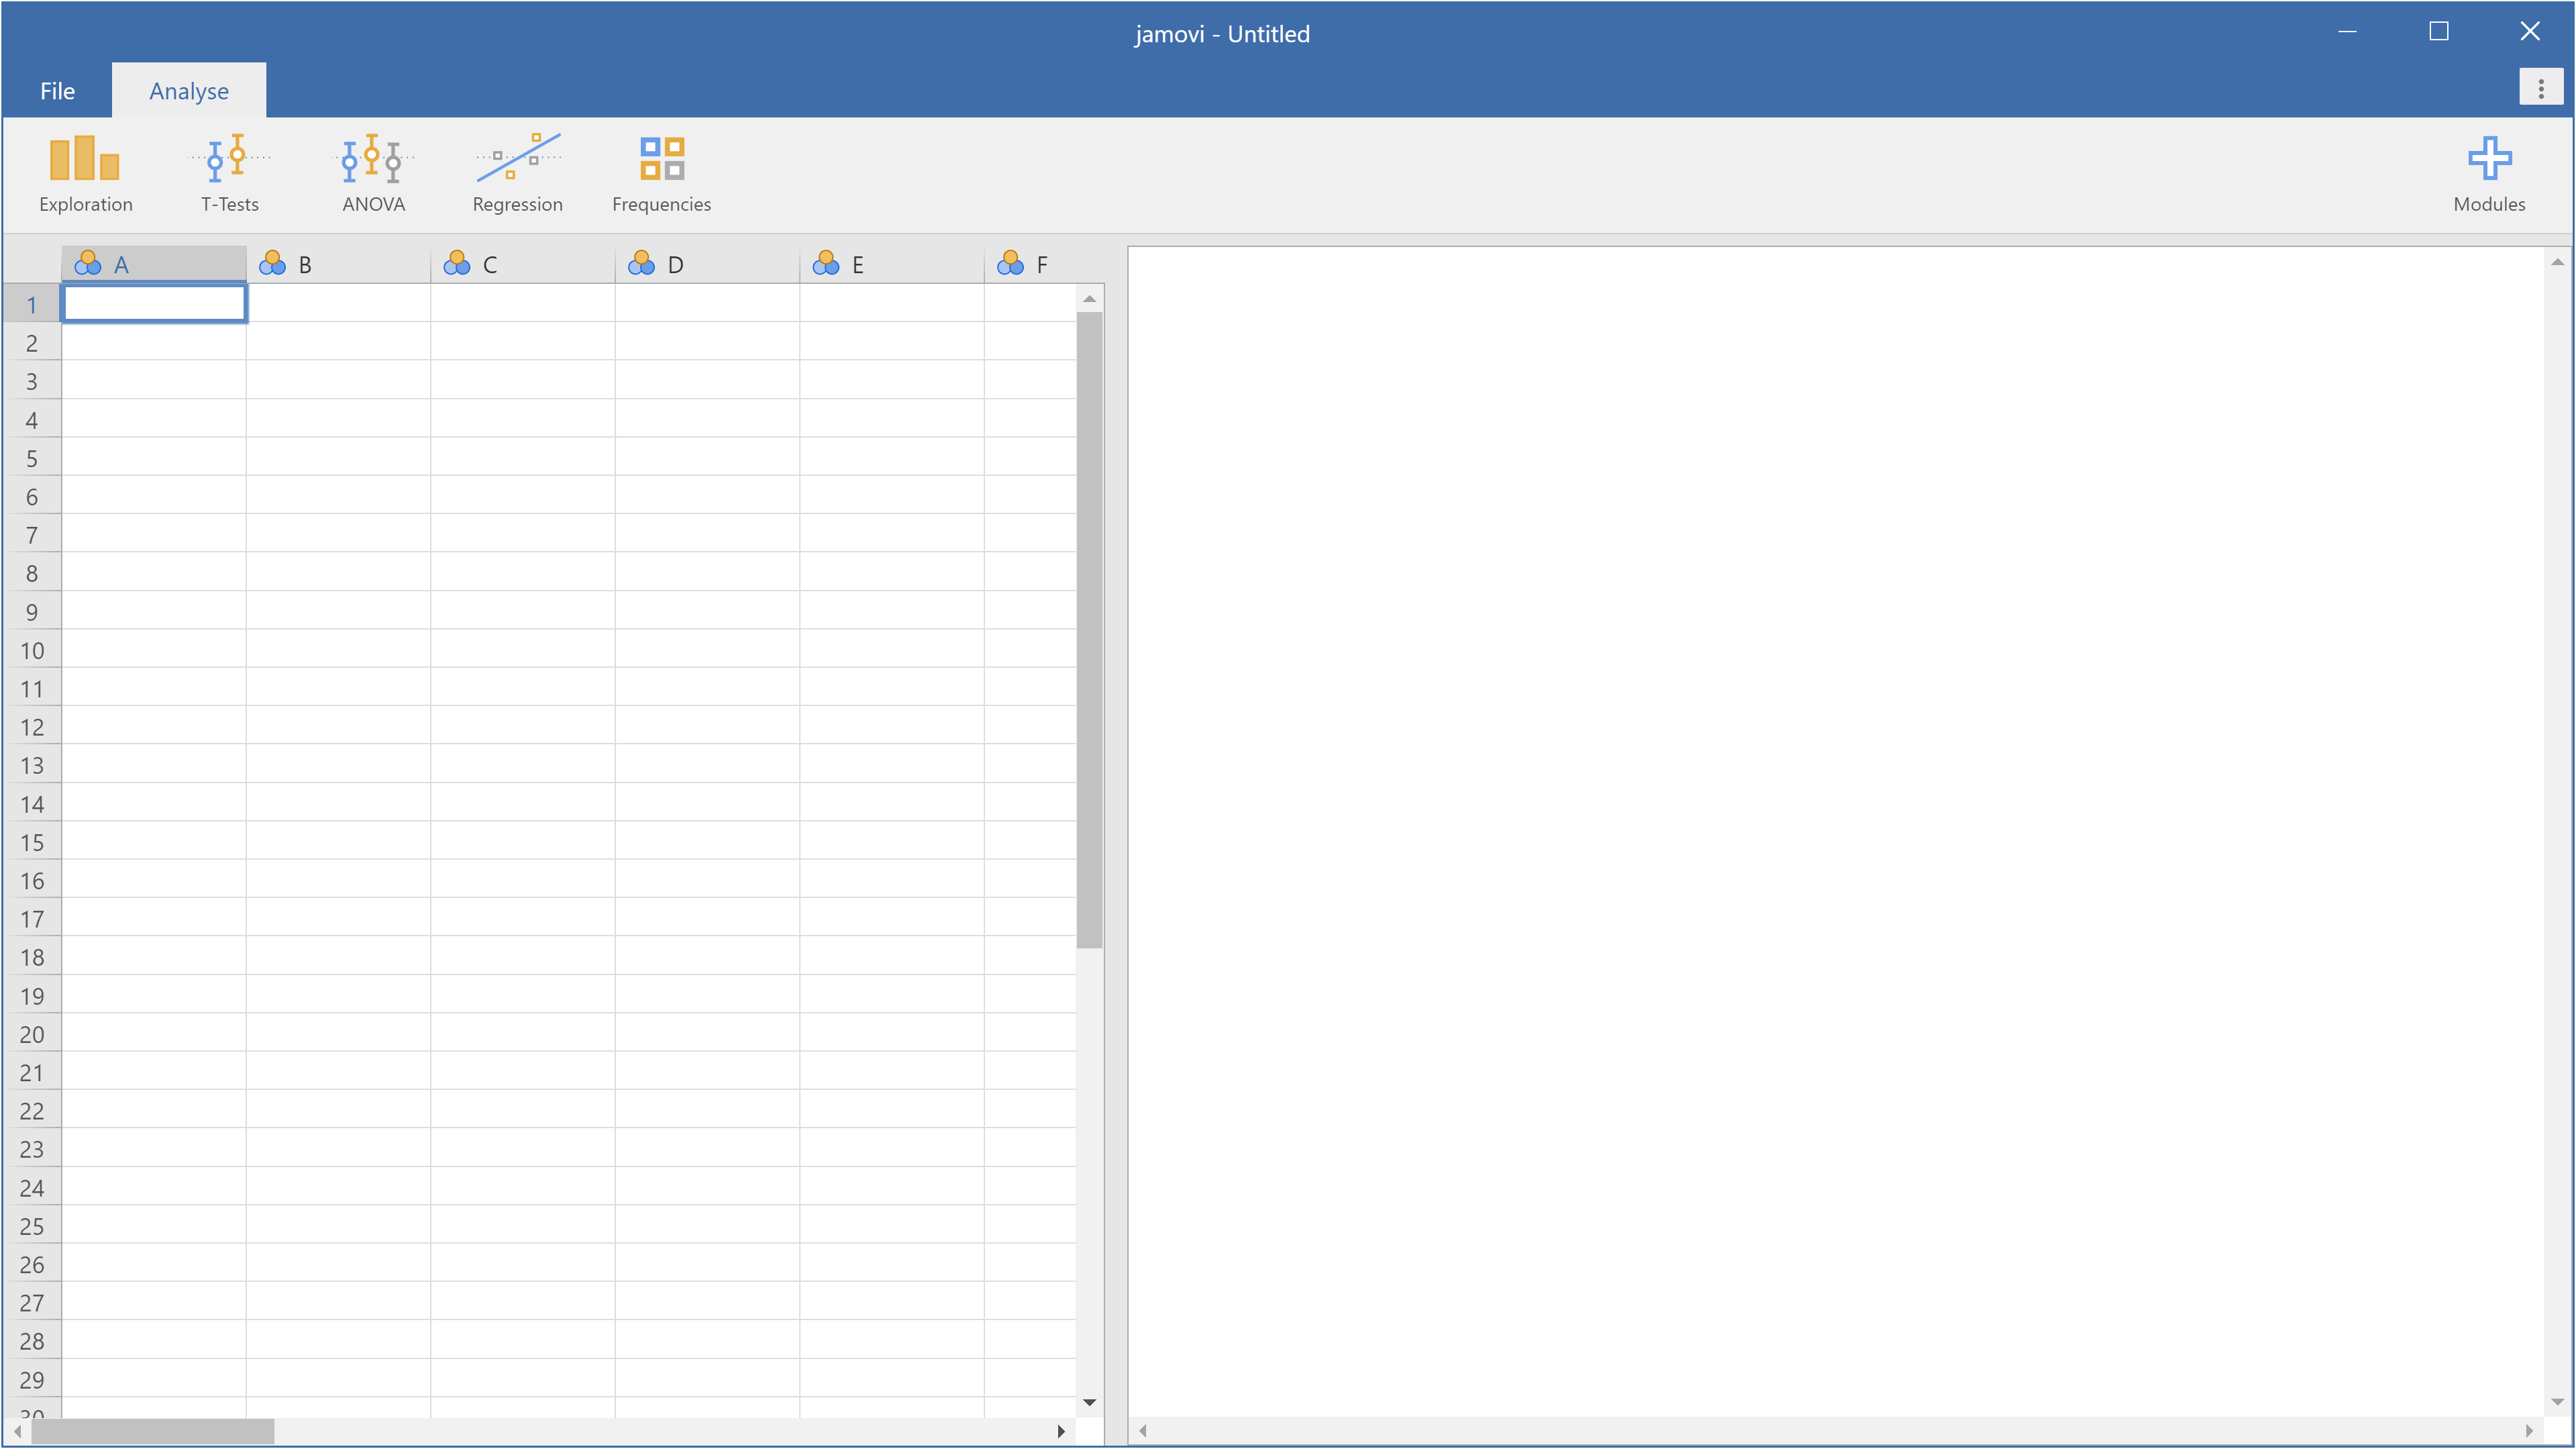
There are three main regions; the spreadsheet to the left, the analyses to the right (there may be no analyses yet, if this is a new data set), and the ribbon along the top. Separating the spreadsheet and the analyses is a splitter that can be clicked and dragged to allocate more or less space to each of these.
It is possible to simply begin typing values into the jamovi spreadsheet as you would any other spreadsheet software. Alternatively, existing data sets in a range of formats (CSV, SPSS, Stata, SAS) can be opened in jamovi. Additionally, there are a number of example data sets available in jamovi. To open a file, select the File tab at the top left hand corner, select ‘Open’ and then ‘Examples’ or ‘This PC’, depending on whether you want to open an example, or a file stored on your computer.
Analyses
Analyses can be selected from the analyses ribbon or menu along the top. Selecting an analysis will present an ‘options panel’ for that particular analysis, allowing you to assign different variables to different parts of the analysis, and select different options. At the same time, the results for the analysis will appear in the right ‘Results panel’, and will update as you make changes to the options.
When you have the analysis set up correctly, you can dismiss the analysis options by clicking the arrow to the top right of the optional panel. If you wish to return to these options, you can click on the results that were produced. In this way, you can return to any analysis that you (or say, a colleague) created earlier.
If you decide you no longer need a particular analysis, you can remove it with the results context menu. Right-clicking on the analysis results will bring up a menu, and by selecting ‘Analysis’, and then ‘Remove’, the analysis can be removed.
The Spreadsheet
In jamovi, data is represented in a spreadsheet, with each column representing a ‘variable’.
Data Variables
The most commonly used variables in jamovi are ‘Data Variables’, these variables simply contain data either loaded from a data file, or ‘typed in’ by the user. Data variables can be one three data types:
IntegerDecimalText
and one of four measure types:

Nominal
Ordinal
Continuous
ID
The measure types are designated by the symbol in the header of the variable’s column. Note that some combinations of data-type and measure-type don’t make sense, and jamovi won’t let you choose these.
Nominal and Ordinal are, predictably, for nominal and ordinal variables. Continuous is for variables with numeric values which are considered to be Interval or Ratio scales (Equivalent to Scale in SPSS). The ID measure type is, unlike the others, unique to jamovi. It’s intended for variables that contain identifiers that you would almost never want to analyse. For example, a persons name, or a participant ID. The advantage of IDs, is that jamovi does not need to maintain a list of levels internally, which can improve performance when interacting with very large data sets.
When starting with a blank spreadsheet and typing values in, the data and measure types will change automatically depending on the data you enter. This is a good way to get a feel for which variable types go with which sorts of data. Similarly, when opening a data file, jamovi will infer the variable type from the data in each column. In both cases, this automatic approach may not be correct, and it may be necessary to manually specify the data and measure type with the variable editor.
The variable editor can be invoked by selecting ‘Setup’ from the data tab, double-clicking on the column header, or by pressing F3. The variable editor allows you to change the name of the variable, and (for data variables) the data type, the measure type, the order of the levels, and the label displayed for each level. The variable editor can be dismissed by clicking the close arrow, or by pressing F3 again.
New variables can be inserted or appended to the data set using the ‘add’ button from the data ribbon. The ‘add’ button also allows the addition of Computed variables.
Computed Variables
Computed Variables are those which take their value by performing a computation on other Variables. Computed Variables can be used for a range of purposes, including log transforms, z-scores, sum-scores, negative scoring and means.
Computed variables can be added to the data set, with the ‘add’ button available on the data tab. This will produce a formula box where you can specify the formula. The usual arithmetic operators are available. Some examples of formulas are:
A + B

LOG10(len)

MEAN(A, B)

(dose - VMEAN(dose)) / VSTDEV(dose)

Z(dose)
In order, these are the sum of A and B, a log (base 10) transform of len, the mean of A and B, and the z-score of dose (twice).
There are many more functions available.
V-functions
A number of functions appear in pairs, one prefixed with a V and the other not. V functions perform their calculation on a variable as a whole, where as non-V functions perform their calculation row by row. For example, MEAN(A, B) will produce the mean of A and B for each row. Where as VMEAN(A) gives the mean of all the values in A.
Additionally V functions support a group_by argument (in 0.9.6 and up). When a group_by variable is specified, a separate value is calculated for each level of the group_by variable. In the following example:
VMEAN(len, group_by=dose)
A separate mean is calculated for each level of dose, and each value in the computed variable will be the mean corresponding to it’s row’s value of dose.
Recoded Variables
Transformed and recoded variables are also available. See this blog post for details.
Filters
Filters in jamovi allow you to filter out rows that you don’t want included in your analysis. For example, you might want to only include people’s survey responses if they explicitly consented to having their data used, or you might want to exclude all left-handed people, or perhaps people who score ‘below chance’ in an experimental task. In some cases you just want to exclude extreme scores, for example those that score more than 3 standard deviations from the mean.
The filters in jamovi are build on top of jamovi’s computed variable formula system, which allows the building of arbitrarily complex formulas.
More details about filters are covered in this blog post
Updating data
Once a data set is set up with filters, computed variables, transforms and analyses, sometimes you may want to update the data. This may be for a number of reasons – It might be that you have a new data set, that you want to apply the analyses you performed earlier to it, or you may be conducting an experiment where you’re tesing a number of participants, and you now have an additional participant’s data to analyse. By importing into an existing data set you can re-run your analyses without having to re-perform all of your data cleaning and analysis steps (making your jamovi files behave a bit like scripts).
For a video introduction to import and templates in jamovi, see this blog post.
Single-file Import
Import is available from the file menu (☰) at the top left of jamovi. When you import a file into an existing data set, the following operations are performed.
- All the rows of the existing data set are deleted.
- All the (original) names of the existing columns are matched to the names of the columns from the new data set.
- The new values are imported to the existing columns, keeping the data and measure types from the existing data set.
- The new columns which did not match names in the original data set are appended to the right of the data set.
If no new column matches the column names in the existing data set, then those columns are left blank.
Following a file import, all the filters, computed variables, transforms and analyses update.
Multi-file Import
It is also possible to import multiple files at once. This can be useful when you are combining multiple data sets, for example, where each file represents a participant. The process is the same as the single-file import detailed above, except that you select multiple files when performing the import. You can do this by holding down control or shift when selecting data files, or with the ‘multi-select’ button at the top of the import dialog.
When importing multiple files like this, they are combined vertically with the rows of the second file appearing below the first, the rows of the third file appearing below the second, and so on. An additional column called source is created detailing which file each row has come from. This can be useful when you need to ‘split-by’ or ‘group-by’ each participant. This column can be particularly useful to use with the group_by argument to V-functions described above.
At present, there is no way to combine files horizontally in jamovi.
Templates
Templates in jamovi are special data sets that are analagous to script files in more traditional statistical environments. They are a way to specify data types, computations, filters, transforms, and analyses in advance. Once the data becomes available, it can be imported into the template, and the template will update accordingly. The nice thing about jamovi templates is that they are entirely specified with the familiar user interface, and do not require working with a ‘syntax’ or code.
To save a data set as a template, select ‘Export’ from the file menu, and select ‘jamovi template’ from the file type box. When opening a template, you’ll see it contains columns but no rows, and that all the analysis results are blank. To use the template, import a new data set (or data sets) using the file import described above. The data will update, followed by the filters, computed variables, and finally the analysis results.
jamovi templates are also a great way to provide analyses to less capable students or colleagues.
Copy and Paste
jamovi produces nice APA formatted tables, and attractive plots. It is often useful to be able to copy and paste these, perhaps into a Word document, or into an email to a colleague. To copy results, right click on the object of interest, and from the menu select exactly what you want to copy. The menu allows you to choose to copy, say only the image, or the entire analysis. Selecting copy, copies the content to the clipboard, and can be pasted into the other program in the usual way.
Syntax Mode
jamovi also provides an “R Syntax Mode”, in this mode, jamovi produces equivalent R code for each analysis. To change to syntax mode, select the Application menu to the top right of jamovi (a button with three dots), and check the “Syntax mode” checkbox there. It is possible to leave syntax mode by clicking this a second time.
In syntax mode, analyses continue to operate as before, but now they produce R syntax, and ‘ascii output’ like an R session. Like all results objects in jamovi, you can right click on these items (including the R syntax) and copy and paste them, for example, into an R session.
At present, the provided R syntax does not include the data import step, and this must be performed manually. There are many resources explaining how to import data into R, and we recommend you take a look at these (Most analyses in jamovi require data as a data frame).
Another R feature that may be of interest is the Rj module, which allows you to use R code to analyse data directly in jamovi.